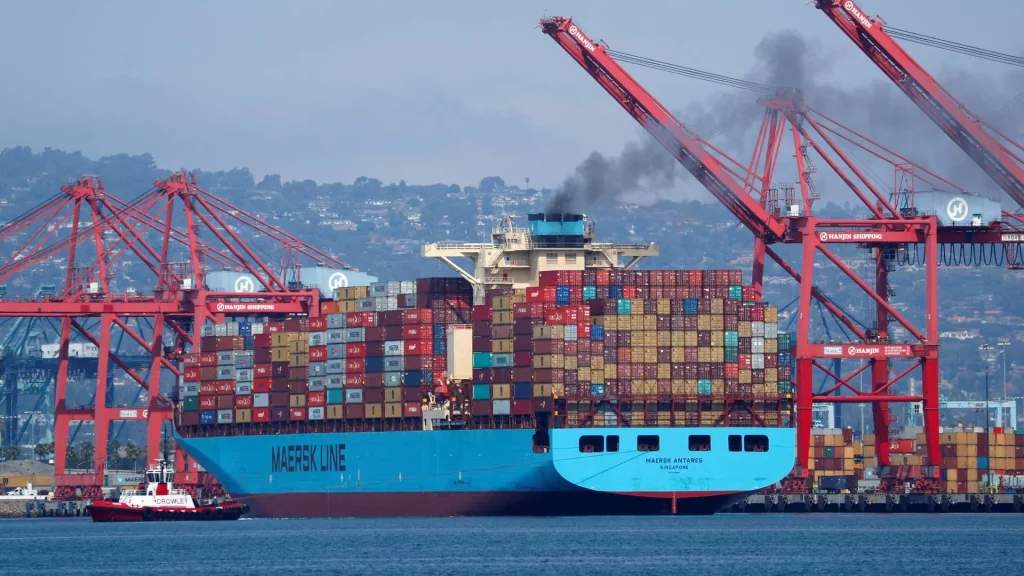
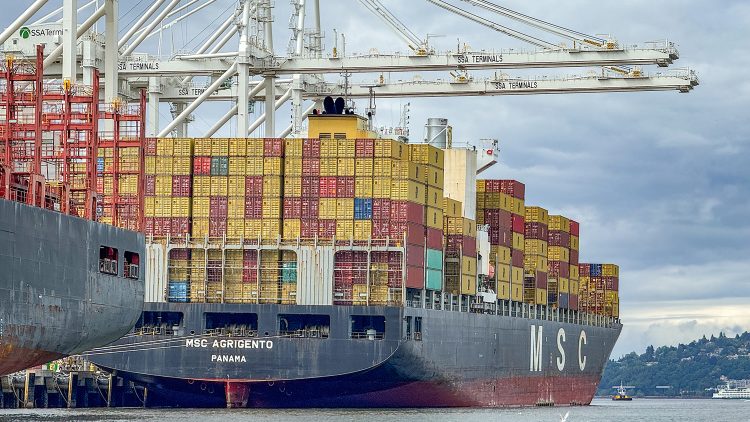
In the second week of July 2024, just as investors were preparing for what many assumed would be a relatively uneventful release of the June Federal Reserve meeting minutes, something quietly began to unravel in the data coming out of Asia-Pacific’s busiest shipping lanes. Automatic Identification System (AIS) trackers monitoring global container movements picked up an abrupt 12% drop in outbound container traffic from Shanghai, Busan, and Singapore bound for the U.S. West Coast. The timing couldn’t have been more curious: within 48 hours of the shipping slowdown, the S&P 500 dropped by more than 2.3%, led by a sudden retreat in retail, semiconductor, and logistics-sensitive equities. While some on Wall Street blamed hawkish language in the Fed’s minutes, others began pointing to something far more physical and immediate—an unexpected slowdown in Asia’s real economy that frontline shipping data had captured before policy signals or earnings revisions could reflect it.
For most investors, AIS data remains an obscure and technical subset of maritime analytics used by cargo operators and commodity traders. But in recent months, hedge funds, quant-driven asset managers, and even TikTok-savvy retail traders have begun looking at these datasets as early warning systems. On July 8, satellite-linked heat maps of outbound cargo flows across East Asia began showing a darkening corridor in the East China Sea and South Pacific lanes, historically linked to consumer goods shipments bound for California and Washington ports. Concurrently, Reddit’s WallStreetBets forum saw a spike in posts discussing shipping delays and retail restocking fears ahead of the U.S. back-to-school shopping season. By the time the Fed minutes were published on July 10, which reinforced the central bank’s hawkish stance on inflation, markets had already begun a selloff.
The drop in Asia-Pacific outbound container volume raised alarm bells not only for what it meant for global trade, but for what it implied about corporate earnings in Q3. U.S. big-box retailers like Walmart, Target, and Costco had only just begun rebuilding inventory levels after a cautious Q2. Analysts tracking maritime traffic noticed that key fast-moving consumer goods categories—footwear, electronics, and packaged food—were underrepresented in the outgoing manifests. This wasn’t just a blip. Weekly port call data showed a significant contraction in container bookings in June, even as U.S. inventory-to-sales ratios were tightening. That divergence—the mismatch between what retailers expected and what suppliers shipped—was enough to raise red flags for some fund managers relying on alternative data signals.
Moreover, the impact didn’t stop with retail. The Philadelphia Semiconductor Index, heavily influenced by firms reliant on East Asian foundries, flatlined in the days following the shipping drop. Korean port data showed a sharp decline in outbound shipments of DRAM modules and NAND flash components. Japanese outbound freight of lithography components also slipped. Investors began pricing in potential bottlenecks, just as U.S. tech giants were entering key manufacturing ramp-ups ahead of the holiday season. The alignment of Asia’s physical trade retreat with a stiffer-than-expected Fed message created a feedback loop: fear of rising capital costs combined with possible supply-side delays.
Dueling narratives quickly formed. On one side, Goldman Sachs and other traditional investment houses downplayed the shipping signals. In a July 11 note to clients, Goldman analysts wrote, “The decline in Asia-to-U.S. container activity is consistent with seasonal trade lulls observed in past years. The market correction appears to be a healthy pause after strong Q2 gains.” In their view, the Fed minutes merely reinforced what was already priced in: inflation remains stubborn, and rates might stay higher for longer. Goldman suggested the S&P 500 drop was technical, not structural, and encouraged clients to view it as a buying opportunity ahead of an anticipated Q4 consumer rebound.

But that view ran headlong into a more contrarian argument, led by independent analysts and non-traditional research shops. Lynette Zhao, a former sovereign wealth fund strategist and author of “Nonlinear Capital Flows,” was among the first to publicly connect the dots between Asia’s shipping slump and Wall Street’s market tremors. Her viral Substack post titled “When Ships Vanish, Markets Blink” argued that institutional models still underweight physical trade data because they rely on backward-looking macro indicators. Zhao highlighted a surge in TikTok videos discussing U.S. product shortages and delayed Amazon restocks, which exploded in engagement three days before the S&P selloff. “These are early indicators of consumer sentiment fracturing at the logistical layer,” she wrote. Zhao’s thesis: the market didn’t sell off because of the Fed’s words. It sold off because the ships weren’t coming—and some AI-driven retail models knew it.
Her view gained traction in alternative investing circles. Satellite imaging firms, which aggregate port activity via infrared thermal signatures, confirmed that nighttime intensity in several major Asia-Pacific terminals had dropped significantly from mid-June onward, suggesting lower shift labor intensity and throughput. Quantitative hedge funds including AQR and DE Shaw were rumored (though not confirmed) to have incorporated such data into pre-emptive trading models in early July. Meanwhile, container futures volumes on the Shanghai International Shipping Exchange spiked—another sign that smart money was already repositioning ahead of the crowd.
This episode shines a light on how non-traditional data is quietly reshaping macro strategy in a post-pandemic world. During the COVID-19 years, container movement, port congestion, and logistics friction became headline metrics. Now, as the world normalizes, many of these signals have faded from the public view—but not from the algorithms that drive institutional capital. The July 2024 sequence—AIS volume drop, social media sentiment spike, and eventual market pullback—offers a textbook case of how information edges evolve. In this case, it wasn’t Bloomberg terminals or Fed officials that gave the early warning. It was satellites, sensors, and sentiment scraping tools watching the quiet movements of steel boxes across oceans.
For companies, this creates a new challenge. If public market valuations are increasingly affected by signals outside of traditional earnings or guidance, investor relations teams may have to respond to issues they can’t directly control. Shipping patterns, Reddit memes, and TikTok complaints may now hold sway over intraday volatility as much as—or more than—official data releases. For the Federal Reserve, it also raises a question: can real-world signals of demand destruction, like container volume drop-offs, be more relevant than lagging CPI prints? Some argue that high-frequency supply chain metrics should be part of the Fed’s dashboard, especially in a world of accelerated pricing expectations.
Whether or not the Fed acknowledges these non-traditional metrics, markets clearly do. July’s brief but sharp selloff reinforced the growing influence of physical economy signals in an increasingly digital world. As asset managers search for alpha in overlooked places, Asia-Pacific’s container ports—watched by thousands of orbiting eyes—may prove more predictive than ever. And the next time the S&P 500 stumbles ahead of a Fed announcement, don’t be surprised if the explanation starts not in Washington, but on a ship quietly idling near the Port of Ningbo.


