Introduction
In the third quarter of 2024, satellite Automatic Identification System (AIS) data revealed a striking divergence in container shipping trends across the Asia-Pacific region. Chinese ports saw a 10% increase in container throughput, reflecting a sharp rebound from earlier logistic disruptions, while Australian ports experienced a 7% decline in container traffic, signaling fresh headwinds for exporters. This contrast raises a central question: why did these two economies—both heavily dependent on shipping—move in opposite directions during the same period? To answer this, we must explore the interplay between export demand, infrastructure, and policy across both countries.
Key Data and Background
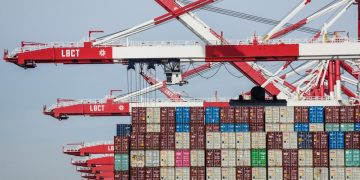
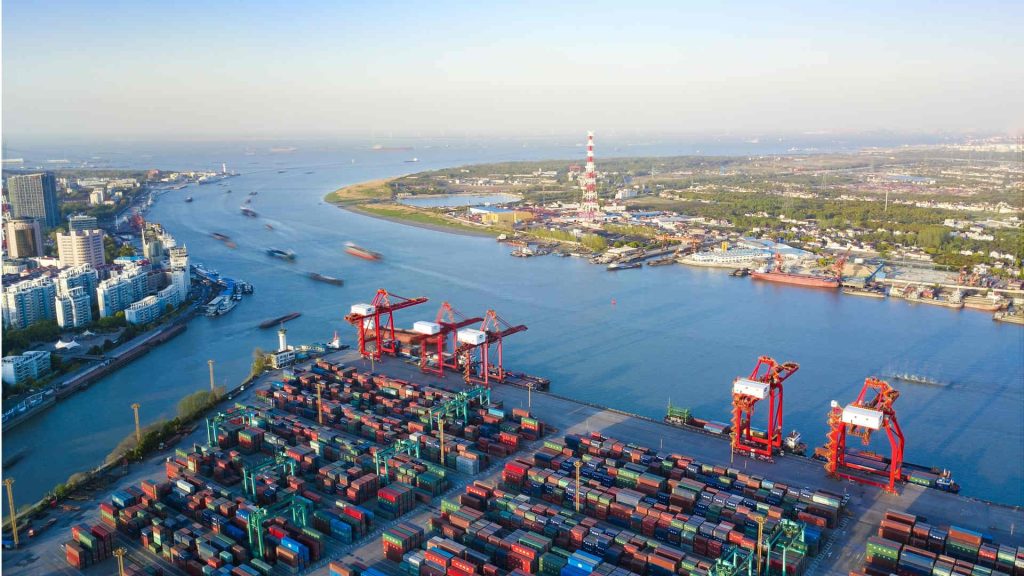
AIS-enabled satellite tracking allows real-time monitoring of ship movements, and Q3 results brought clear regional divergence. China saw a roughly 10% rise in container calls across major hubs like Shanghai, Ningbo-Zhoushan, and Guangzhou, aligning with official customs and port data that noted a 9.6% uptick in containerized trade. This uptick occurred despite prior disruptions from Cyclone Bebinca and lingering COVID-related slowdowns, suggesting a sturdy export rebound. Meanwhile, Australia’s main ports—Melbourne, Sydney, Brisbane, Fremantle—recorded a 7% drop in containerized volume compared to Q3 2023. Local analysts pointed to blanked sailings, high port fees, and reduced commodity shipments as contributing factors. This split between export-driven strength in China and weakness in Australia reflects broader shifts in global trade patterns.
Cross-Market Impact
China’s rising container throughput supports broader Asian manufacturing recovery. Enhanced logistics and export competitiveness boost industrial output, reinforce GDP forecasts, and stabilize commodity demand. For Australian exporters, the decline signals tighter resource export conditions. Though Australia primarily moves raw commodities via dedicated terminals, the container drop hints at broader supply chain and trade stress that may affect agriculture, manufactured goods, and international trade finance flows. With reduced port throughput, Australian shippers may face higher costs from idle inventory and strained logistics. Moreover, investors in shipping equities and port infrastructure must now contend with diverging regional dynamics—Chinese assets benefit from growth momentum while Australian assets face downside risks.
Diverging Expert Perspectives
Chinese customs officials and trade authorities attribute the port surge to solid export demand across Southeast Asia, North America, and Europe, coupled with improved clearance systems and resilient supply chain mechanisms. In contrast, Australian trade analysts sound the alarm on structural contrasts: weakening global demand, rising logistical costs, and supply chain inefficiencies. They caution that this divergence isn’t merely short-term but indicative of deeper policy and infrastructure gaps. Australian exporters face rising cost structures, slower vessel schedules, and increasing competition from Southeast Asian ports, jeopardizing their regional competitiveness.
Future Prospects and Strategy
Looking ahead, several potential trajectories emerge. If global demand continues to firm—especially for Chinese-made goods—the container surge could persist, supported by further investments in port automation and trade facilitation. China’s targeted industrial and trade policies may sustain momentum into 2025. Australia, meanwhile, risks deeper container slippage unless it addresses port efficiency, regulatory burdens, and diversifies export products. Reforms aimed at reducing fees, promoting rail–port synergies, and adopting digital logistics platforms could counterbalance demand-driven declines.
Logistic companies and shippers can proactively manage risks by monitoring AIS flows, engaging with regional operators for flexible port options, and recalibrating supply chain routes. Trade financiers should assess export variation, potentially shifting exposure toward rapidly growing corridors and factoring port throughput trends into trade credit models.
Conclusion
The Q3 2024 container data divergence reflects contrasting national experiences: China’s strong export-led rebound and Australia’s exposure to sluggish demand, logistics friction, and structural rigidity. For businesses, investors, and policy makers, the insight is clear: port throughput is a vital trade signal, and its divergence demands differentiated, region-specific responses. Will Australia implement reforms to close the gap, or will China’s export resilience leave its peers behind?


