


Introduction
In the second quarter of 2025, satellite data revealed a striking 15% increase in global port congestion, sparking intense debate among commodity analysts and traders worldwide. This rise in shipping delays came amid heightened volatility in the prices of key industrial metals such as iron ore and copper, raising a provocative question: can satellite-derived shipping congestion metrics serve as more accurate predictors of commodity price swings than traditional inventory and supply-demand indicators? While conventional metrics like stockpiles and production reports have long guided market forecasts, recent advances in satellite imaging and data analytics offer a new, real-time lens on global trade flows. This article delves into the emerging evidence, contrasting these two approaches and exploring their implications for commodity markets and emerging economies dependent on exports.
Key Data and Background
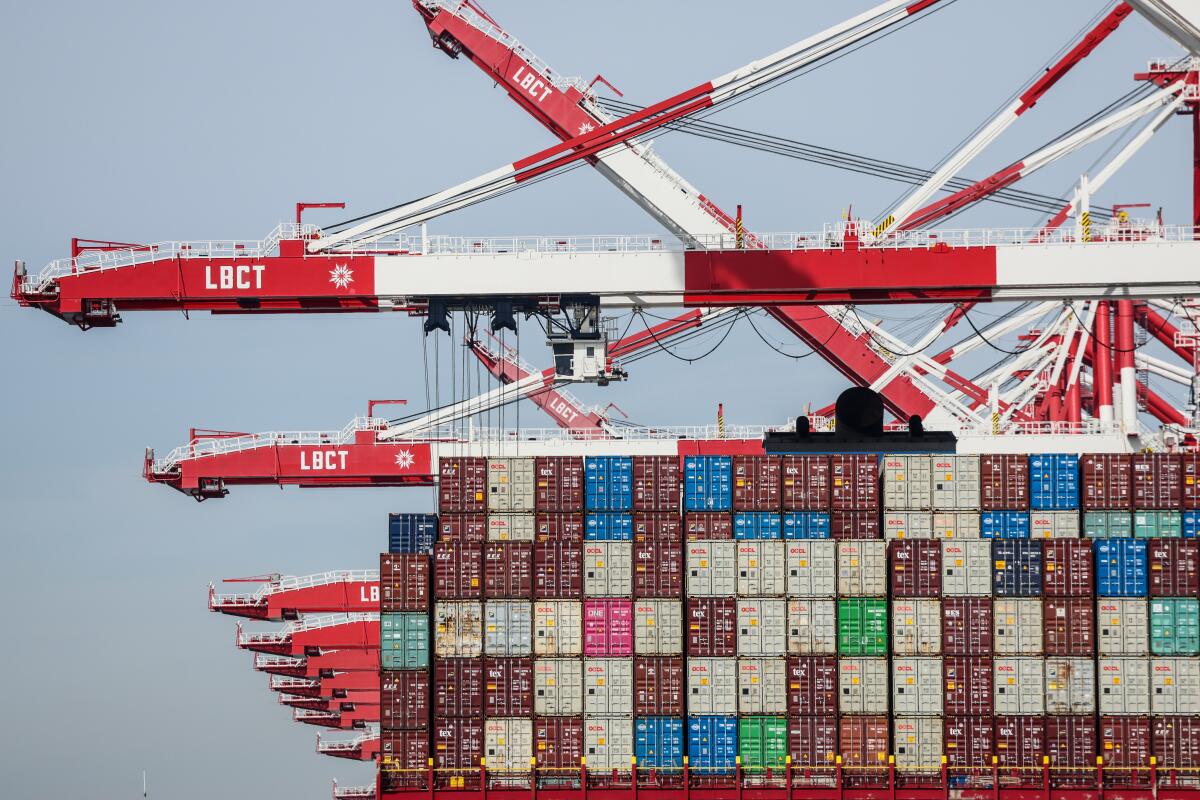
Satellite monitoring technology has rapidly evolved, enabling near real-time tracking of shipping traffic at global ports. In Q2 2025, data from leading satellite analytics firms showed a 15% surge in congestion across major hubs such as Singapore, Rotterdam, and Los Angeles. These congestion indices integrate vessel queue lengths, berth wait times, and anchorage delays, providing a dynamic picture of supply chain bottlenecks that traditional metrics cannot capture instantaneously.
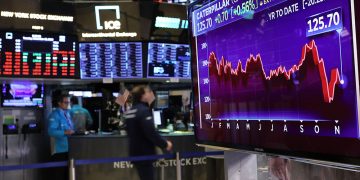
Simultaneously, commodity price volatility for iron ore and copper intensified. Iron ore prices experienced swings of over 10% within weeks, while copper’s volatility index hit multi-year highs. Historically, analysts have relied heavily on inventory reports, import-export balances, and production forecasts to predict such fluctuations. However, these traditional indicators suffer from delays, limited transparency, and inconsistencies in reporting across regions.
The real-time nature of satellite data offers a compelling alternative. It reflects physical shipping constraints that directly affect the timing and volume of commodity deliveries. This timely insight can preempt supply shocks before they manifest in inventories or official statistics.
Cross-Market Impact
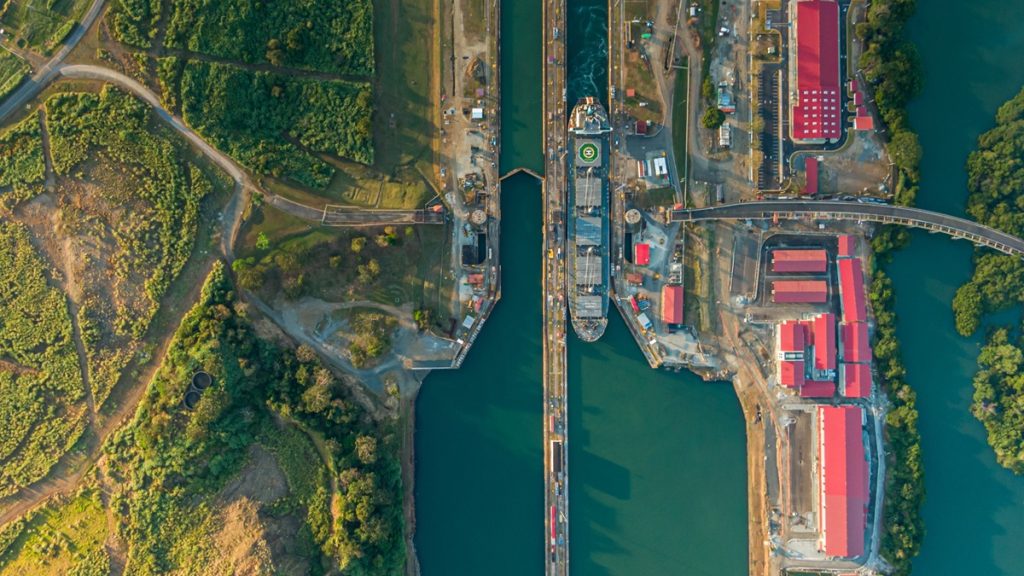
The uptick in port congestion has sent ripples through global commodity markets. Supply chain slowdowns magnify price volatility by increasing uncertainty over delivery schedules. Producers and consumers face challenges in inventory management and contract negotiations as physical delays undermine planned supply flows.
Emerging market exporters, heavily reliant on commodity shipments, bear the brunt of these disruptions. For countries like Brazil and Chile, prolonged port congestion delays shipments, impacting revenue timing and currency stability. Conversely, some exporters benefit as price spikes temporarily boost income, despite logistical challenges.
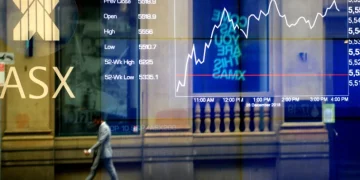
Moreover, congestion-driven price signals influence commodity futures markets and derivative trading volumes, amplifying financial market reactions. This interconnectedness underscores the strategic importance of accurate congestion metrics for market participants and policymakers.
Comparatively, traditional inventory data failed to anticipate the Q2 2025 volatility spike with the same precision, due in part to reporting lags of weeks or months. Satellite-derived metrics provide forward-looking indicators, capturing disruptions as they happen and offering early warnings that help reduce blind spots in commodity risk assessment.
Divergent Expert Opinions
International trade organizations recognize satellite congestion data as a vital supplement to conventional tools. The World Trade Organization recently highlighted how satellite analytics enhance transparency and timeliness in monitoring global trade flows. They argue that integrating these data with traditional indicators improves forecasting accuracy and supports better policy responses.
However, some traditional market analysts caution against overreliance on satellite data alone. They stress the importance of fundamental factors like production capacity, geopolitical risks, and macroeconomic trends that satellites cannot capture. According to these experts, satellite congestion metrics should complement—not replace—established fundamentals to provide a holistic view.
This debate echoes broader tensions in financial markets between data-driven quantitative models and qualitative assessments. Nobel laureates in economics have weighed in, emphasizing that while big data and AI provide powerful tools, human judgment remains crucial to interpret signals within complex market ecosystems.
Future Outlook and Strategic Recommendations
Looking forward, satellite-derived congestion metrics are poised to play an increasingly important role in commodity market analysis. Advances in remote sensing technology, combined with AI-driven data integration, will deepen insights into supply chain dynamics and pricing pressures.
Market participants should consider adopting a hybrid approach: leveraging satellite data for early detection of physical bottlenecks while maintaining rigorous analysis of fundamental economic factors. Investors might focus on monitoring port congestion trends alongside inventory reports to anticipate price volatility more effectively.
Emerging market exporters should enhance logistics resilience and diversify shipment routes to mitigate congestion risks. Policymakers can use satellite insights to target infrastructure investments and trade facilitation efforts, reducing bottlenecks that exacerbate commodity price swings.
Conclusion
The 15% rise in global port congestion observed via satellite data in Q2 2025 provided a sharper and more immediate indicator of commodity price volatility than traditional inventory metrics. This emerging tool enriches market understanding by offering real-time visibility into supply chain disruptions. While not a standalone predictor, satellite-derived congestion metrics are an indispensable complement to fundamental analysis, helping stakeholders navigate the increasingly complex landscape of global commodity trade.


